Calculus Third Edition
PDF files should be printed before use.
1.5.1How do position and velocity relate?
Area and Slope
FREDO AND FRIEDA RETURN
Fredo and Frieda each recorded data for a different race, as shown below. This time the students are not so sure their data matches. The coach has turned to you for help. Decide which student measured distance and which measured velocity. Identify ways to decide if the graphs represent the same data. Be prepared to share your methods to confirm whether the data collected by each student matches the others.
Fredo’s Graph
Frieda’s Graph
.png)
College Admissions Writing Prompt
Be sure to draw distinctions between actual position, displacement, and total distance. What extra information do you need to determine actual position from a velocity graph? |
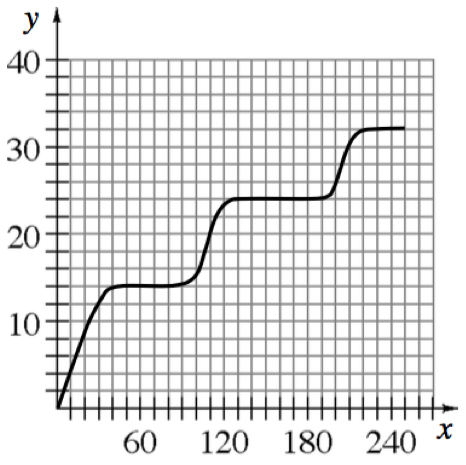
So far in this chapter, you have determined information about acceleration and distance from a velocity graph. You have developed ways to calculate total distance or displacement. Now, we want to write a function for the distance over time. Using the graph below:
.png)
Write a piecewise-defined function for the velocity graph.
Copy and complete the table below for distance traveled over time. Assume that
. Plot the distance verses time graph
from the table completed in part (b). Write the piecewise-defined function for the distance versus time graph.
A particle is moving along a straight line. The velocity of the particle is shown on the graph below.
.png)
At what point is the velocity greatest?
At what point is the speed greatest?
Where does the particle change from moving forward to moving backward?
Where is the acceleration positive?

NOT AGAIN!
Theo has done it again. Before he lost his graph, he used it to determine the following properties of his motion. Help him re-create a possible graph of this motion. Homework Help ✎
Details:
He changed directions three times during his
-foot walk. His average velocity was
feet per second. Theo walked for
seconds and started feet from the motion detector.
Carefully graph
Given the tables below: 1-196 HW eTool. Homework Help ✎
Write possible equations for the functions
, , and . Evaluate:
The population of Smalltown on January 1st for
Write a slope statement for the given data.
Calculate the average rate of change per year in the population between 2011 and 2015.
Approximate the rate of change of the population on January 1st, 2014. Explain how you got your answer.
2011 | |
2012 | |
2013 | |
2014 | |
2015 |
Draw two different distance graphs that each has an average velocity of
The area between the
Write the equations of two non-trivial functions
Shehazana, who is
.png)
State the domain of each of the following functions. Homework Help ✎
Multiple Choice: When the graph of


